Risk Management with Artificial Intelligence, Machine Learning - Advanced Analytics
CobbleStone Software offers the VISDOM™ risk engine that leverages statistics, artificial intelligence (AI), machine learning (ML), and advanced analytics to help reduce risk and recognize patterns with structured data. Artificial Intelligence, along with correlation and regression, has been added to CobbleStone Software Enterprise Edition to help with using advanced statistics to recognize risk and positive and negative relationships of data and patterns. Once a pattern or a trend is detected via correlation and regression analysis, rules can be set to enable the CobbleStone Software AI Engine to make intelligent recommendations based on the data and rules configured and it can learn. It learns not only from the configuration it receives but adjusts based on new data and patterns found. This provides a standards-based method to recognize risk and re-evaluate outlying risks and make new recommendations over time.
Note: Regression and statistics are a complex area of mathematics and should be confirmed by a qualified expert. To confirm your analysis, seek legal advice from an attorney and confirm statistic with an actuary or qualified personal.
Getting Started
Configuring and teaching the Risk Engine (a regression example)
Oftentimes, professionals know their data and the trends related to their data as they are typically experts in their field or they simply were taught by anther “expert”. In mathematics, to confirm if the data meaningful there are mathematics tools built to test data and its relationship to each other. In other words, there is a math to confirm our thoughts and hunch on how data may be related. VISDOM Risk Engine attempts to make it simpler to use these tools and test data. A System Admin user can utilize these tools documented in the Testing Data for a Regression and Risk Analysis section of this documentation. [To perform a test of the data you want to analyze, log into the system as a System Admin user. Note, these tests are not stored in the system, they are just tools to confirm the relationship of data. The Risk Analysis with regression engine can be found under the Manage/Setup - Application Configuration - Risk Analysis Configuration menu.
Once the data and two data points have been confirmed as having a strong relationship or are defined by your organization, VISDOM can utilize these risk analysis tool in the CobbleStone Risk Analysis Engine. If, in your system, your team did not track the data fields needed for your analysis, it is easy to create a user-defined field on the main objects (such as Contract, Vendor/Customer, Employees, Purchase Orders, Sourcing, Request screens) in CobbleStone Software documented elsewhere in this Wiki.
Our example: In our example, we assume that we provide engines for lease to our customers. The engines are leased under an Engine Lease Contract for twelve months and are offered at one engine per lease. The customer may lease several types of engine include a 200 Horse Power (HP) engine, 400 HP engine or a 600 HP engine. Below we will use the Risk Engine to detect if the lease value (the contract amount) of our contracts is higher based on the type of engine we lease; greater HP equates to a higher price. To utilize regression and advance analysis for risk mitigation, navigate to the Risk Analysis home scree and click Add Definition.
Creating a Risk Analysis Definition
Since, we lease three engines types: a 200 HP (horse power) engine, a 400 HP engine and a 600 HP engine, we want to check that the contract data we track when we lease an engine is priced higher for a larger HP engine. For this example, we must first look at the data just for Engine Leases that are either 200 HP, 400 HP or 600 HP. Since, this company makes most of is revenue from 600 HP Engine Leases, we will analyze (filter) the data for 600 HP Engine Leases.
1. Log in as a System Admin user.
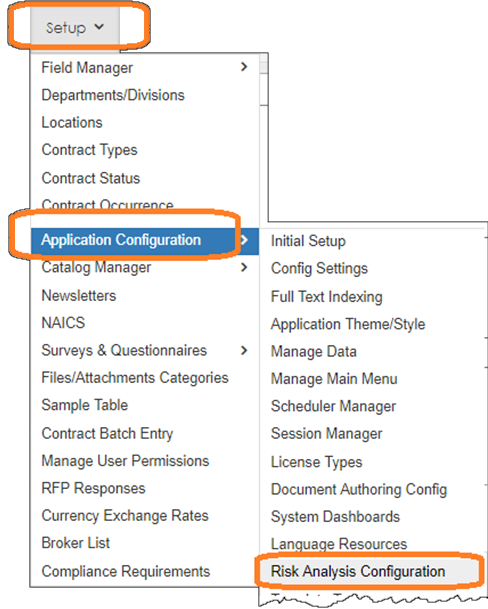
2. From the main menu, select Manage/Setup - Application Configuration - Risk Analysis Configuration.
3. The Risk Analysis testing tool home page displays.
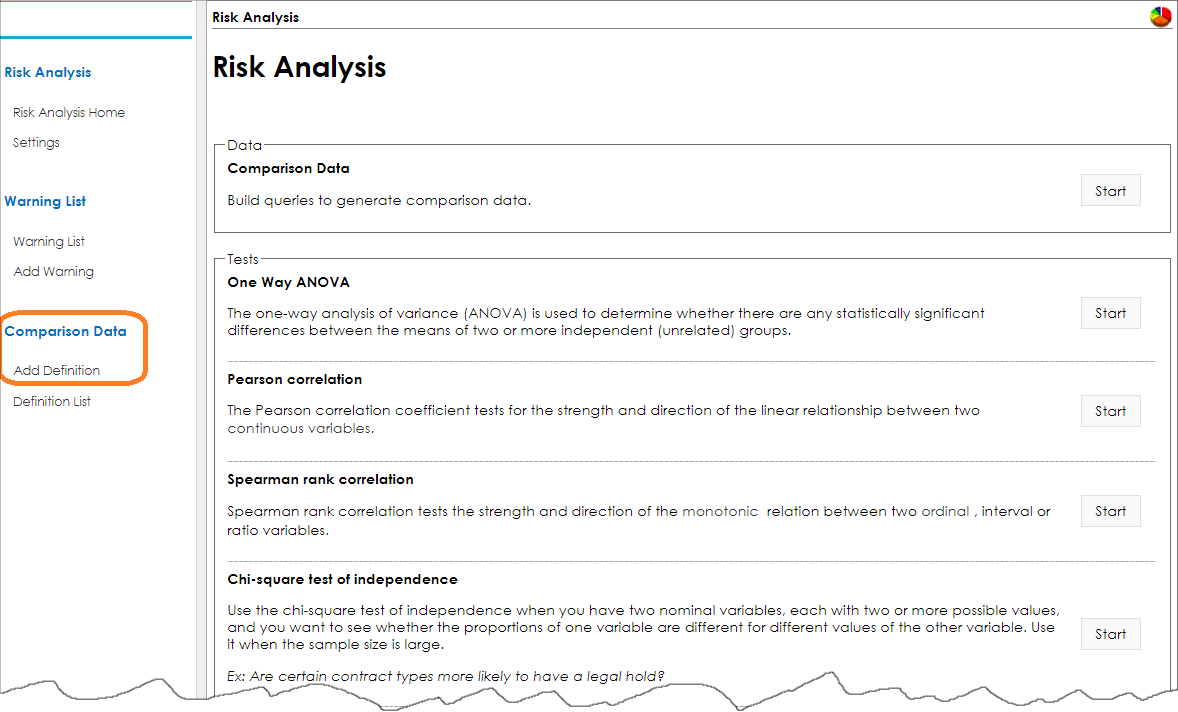
4. Click Add Definition on the side menu in the Comparison Data section.
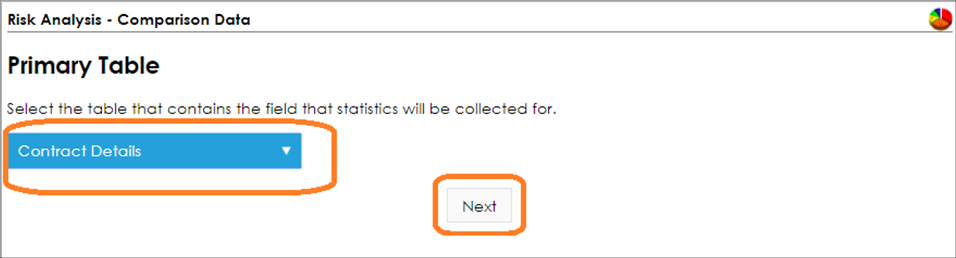
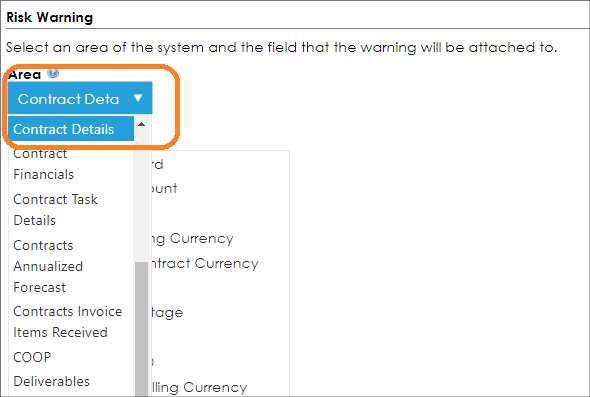
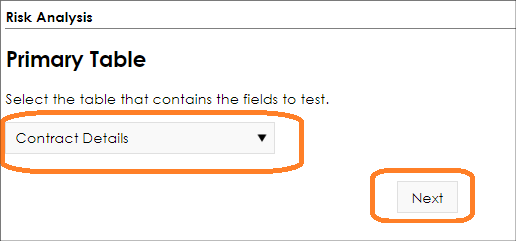
5. Like during Risk Analysis Testing, select the Primary Table to narrow the data source we want to analyze. For this example, we will use Contract Details as we want to base our risk monitoring for this example [or business case] using the data fields on our contract records.
6. Click Next.
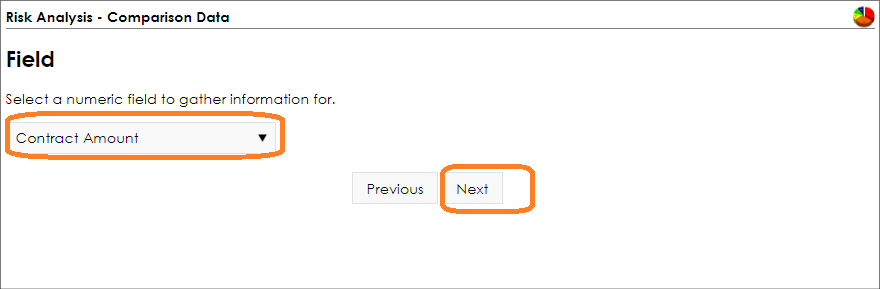
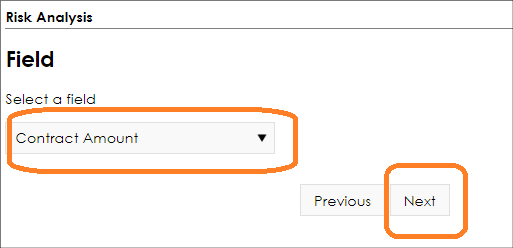
7. Select the first field variable to configure for the analysis. In this example we want to confirm the Contract Amount as it relates to the engine horse power rating, so we select Contract Amount.
8. Click Next.
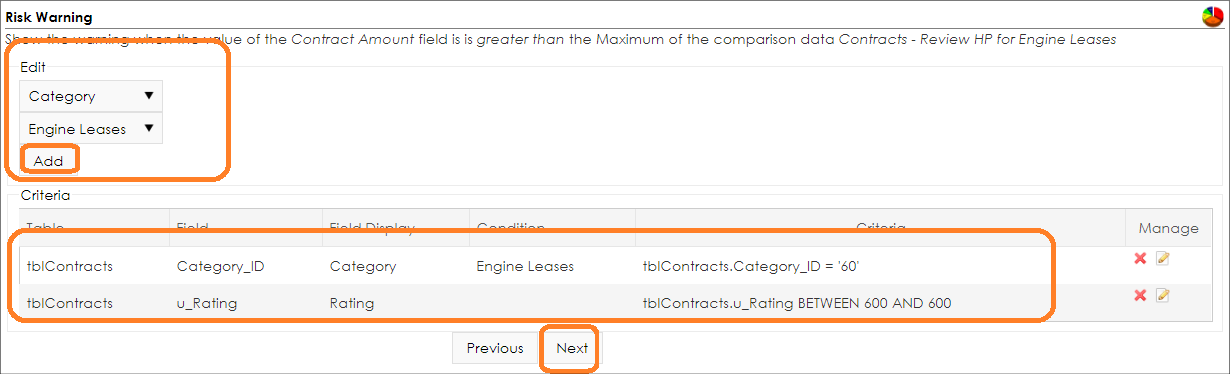
Next, we added two filter conditions to only have the analysis engine look at Engine Leases that are 600 horse power, so we need to set filter conditions for both the Rating Category fields for this purpose.
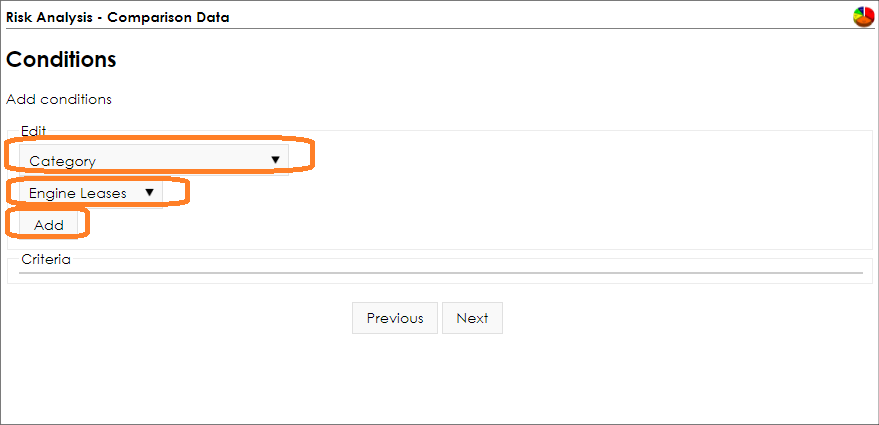
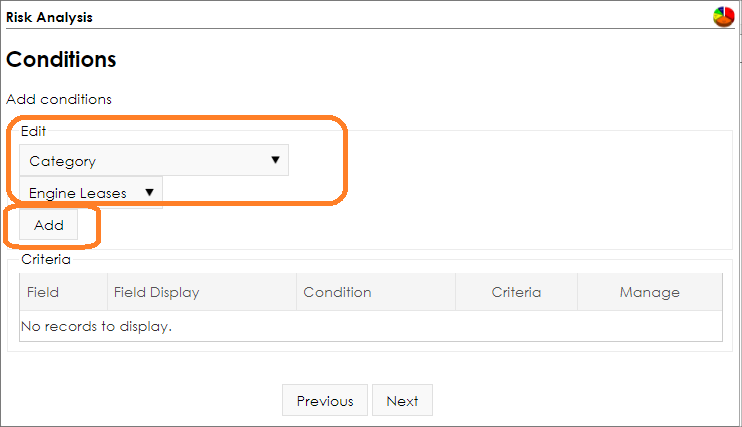
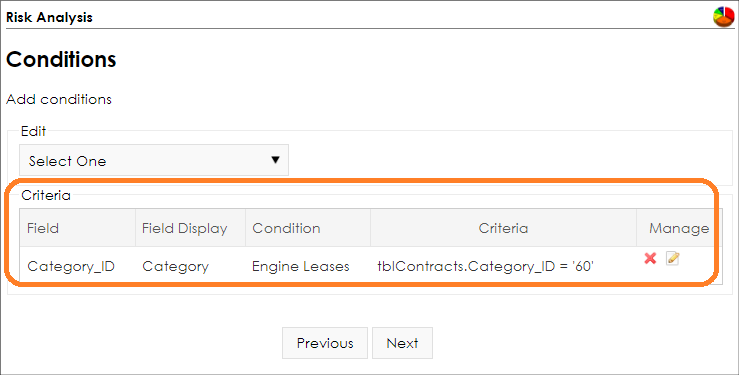
9. Set the filter conditions based on the field(s) and field value(s).
Since we only want to look at Engine Leases (and not Non-disclosure Agreements, Employment Agreements, or any other agreements for this analysis), we need to set a filter on the Category field, so we only include Engine Leases. Next, we need to set a filter condition on the Category field where it equals Engine Leases. In your business case, select the appropriate field or filters.
10. Once set, click Add.
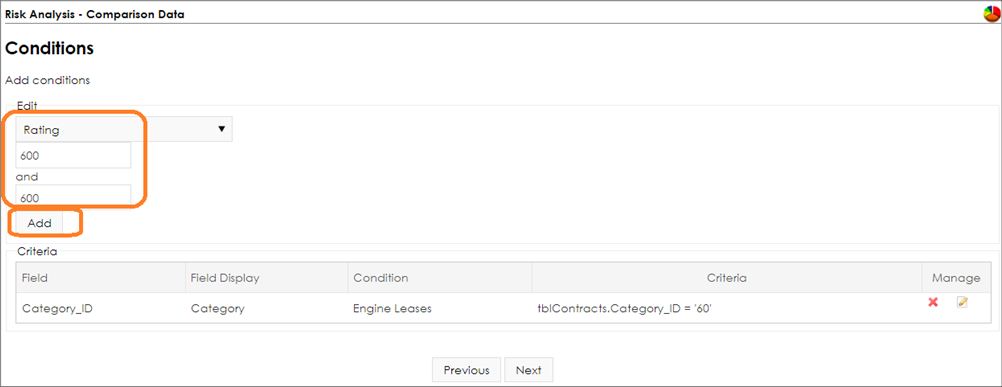
Next, we need to a filter condition on the Engine Rating (rated horse power) where the Engine Rating is between 600 and 600 since we just want to define this rule for 600 HP engine leases. Since we know our data, the Rating Field is be used for this filter condition.
11. After setting all the conditions, review and modify the them as necessary. To edit a condition, click the pencil icon ( ). To delete a condition, click the red X icon ( ). To delete a condition, click the red X icon ( ). ).
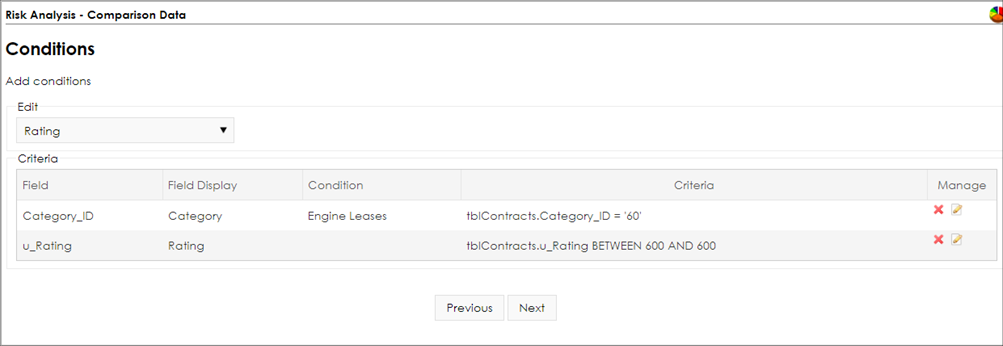
12. Click Next.
Machine Learning Schedule
Since we want the risk engine, VISDOM, to learn from the new data and contracts that are entered and from changes to any existing contract data, we schedule it to learn from the data based on a schedule. Just image if the sales team increases the pricing for engines. The system can learn from this new pricing change based on the new contract data it finds. For this example, we will have the Risk Analysis Engine learn and adjust what it finds monthly.
Setting the Schedule
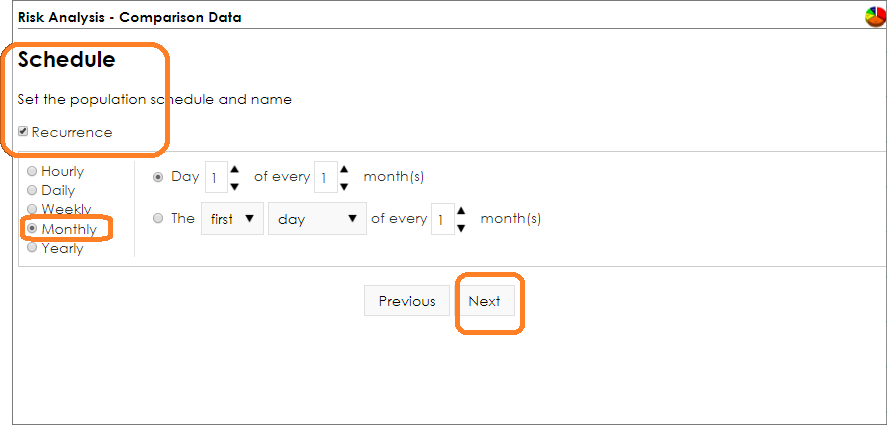
Note: setting the schedule to more frequent, like Daily will enable the engine to learn from the new data faster. But if the data does not change daily, it is wasteful to have the engine run too frequently. In most cases, statistics need a lot of data to work well (or a large sample size). It may be better to adjust Monthly if you want to smooth data (such as for averages and cycle trends) or you may want to set the scheduler to a longer period.
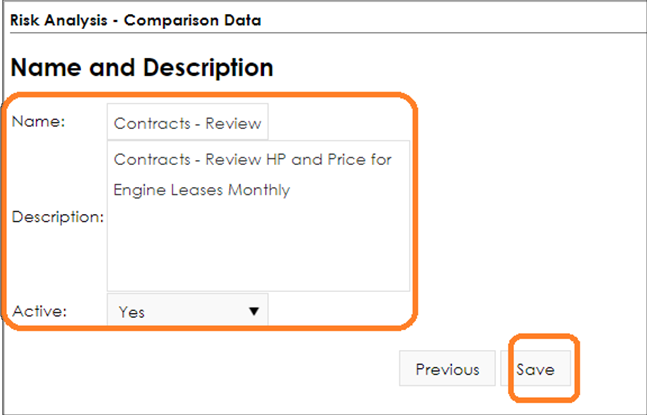
1. Give the Risk Analysis job a Name, set a Description, and mark it as Active.
2. Click Save to save the risk management machine learning job.
3. The Comparison Data Definitions screen displays with the saved analysis configuration.
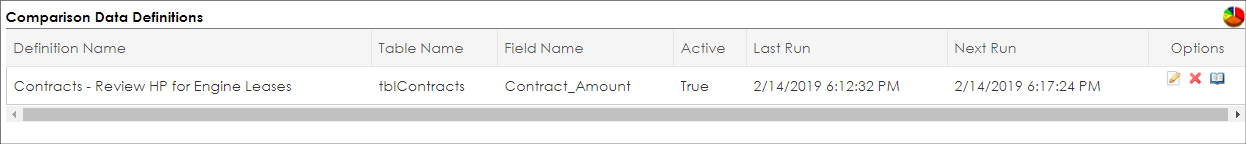
4. To edit (or review) the Risk Analysis job setting, click the pencil icon ().
5. To delete a Risk Analysis Job, click the red X icon ().
6. To view the analysis the job and the data gathered, click the book icon ( ). ).
Note: To view the analysis the first time, run the Risk Engine job scheduler. In our example, we set our job to run monthly and it has not been a month since we scheduled the job (see Manually running the Risk Engine Scheduler below).
Manually run the Risk Engine Scheduler
To manually run the Risk Engine Scheduler job:
1. Log in as a System Admin user.
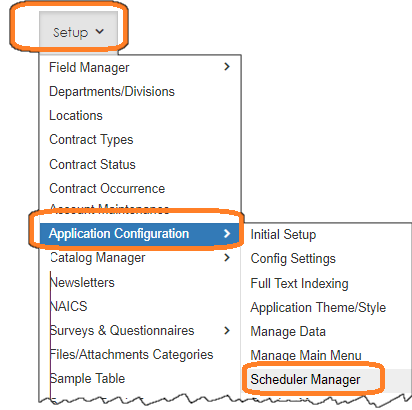
2. Navigate to Manage/Setup - Application Configuration - Schedule Manager.
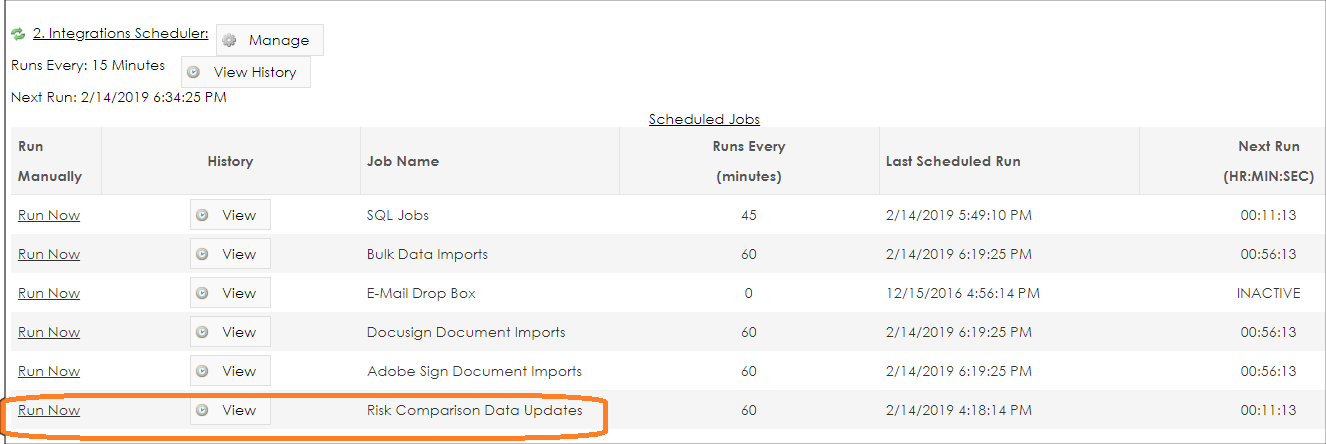
3. Locate the Risk Comparison Data Updates schedule [see below] and click Run Now. Give it some time run as complex analysis takes time.
4. Once the job runs, navigate aback to the Risk Analysis Configuration menu.
5. On the side menu, click Definition List.
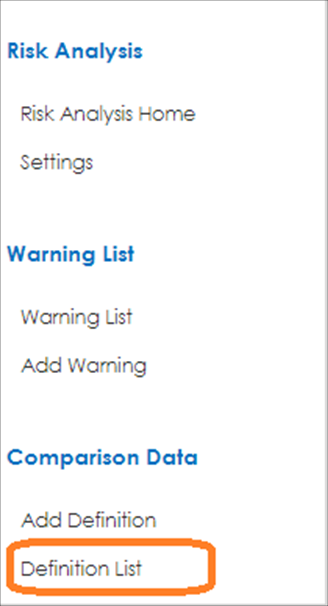
6. The Comparison Data Definitions List appears, click the book icon to view the results.

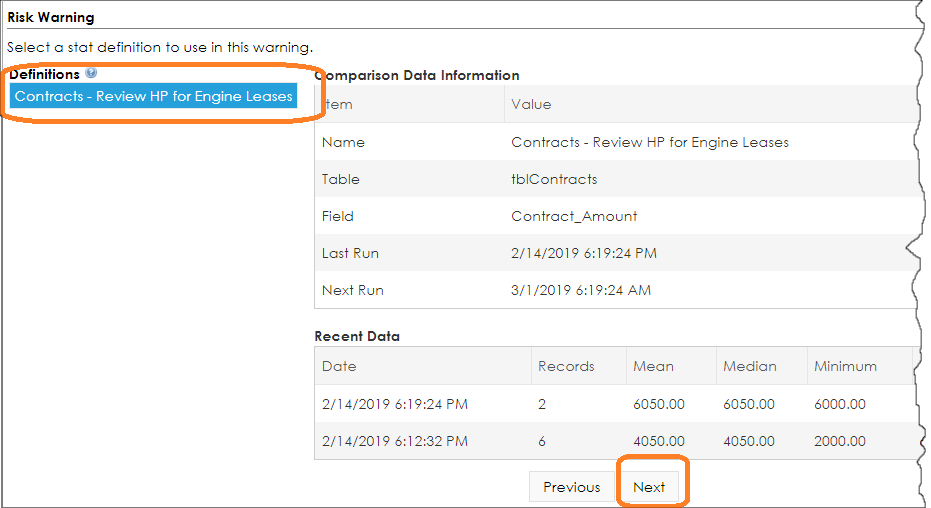
7. The data from the schedule is found in the Risk Comparison Data details screen.
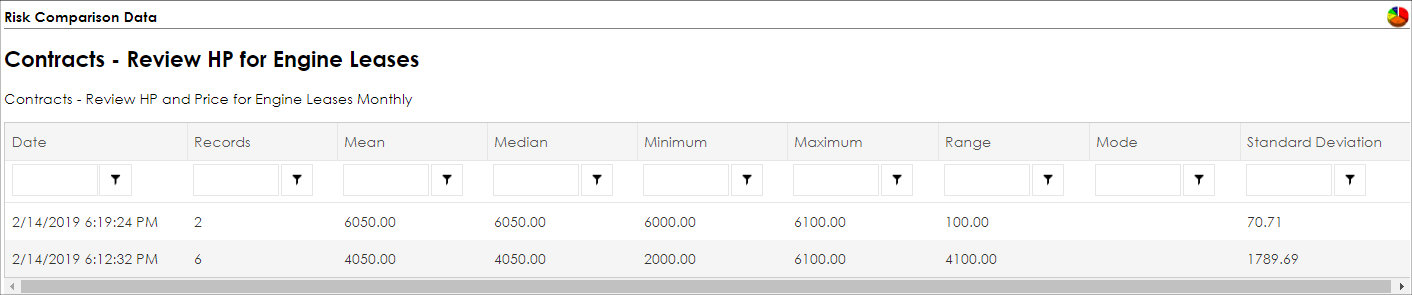
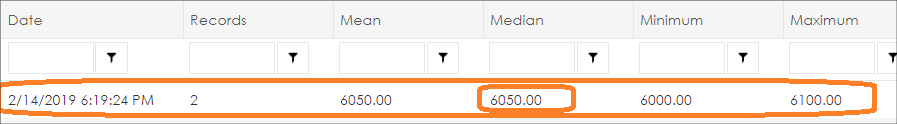
Now that we have the data analyzed, we can interpret it. We can see that the Median (average) price for a 600 HP Engine Lease is $6,050.00 and the Minimum value is $6,000.00 and the Maximum value was $6,100.00.
Now that we have this useful data, we use it to help our staff and company. Let’s imaging a sales person sells a 600 HP Engine Lease for $7,000.00 dollars. That is good; they sold the engine lease at a contract value higher then highest deal for a similar engine. We can show our users positive reinforcement messages as each salesperson sells 600 HP engine leases at or above the latest highest value. We can add an on-screen alert on the Contract Details screen letting them know they did a good job by exceeding the highest sales amount. Moreover, since we can enable a learning engine, we can have the system adjust its rules based on the latest contract data. Conversely, if the sales person enters a contract value less the $6,000.00 [or the lowest value of a 600 HP Engine Lease], we can warn them to check the pricing as it seems to low. If they are 20% over the median, we can reward them.
Once a pattern or a trend is detected via correlation and regression analysis, rules can be set to enable CobbleStone Software AI Engine to make intelligent recommendations based on data. This provides a standards-based method to recognize risk and re-evaluate the outlying risks. For advance intelligence, have your criteria update over time to enable the systems to learn (via Machine Learning). A good example of this is that your risk team may want to find out if your financial exposure on services your firm provides to detect if the financial exposure is too high for the price of the contract.
These risks monitoring onscreen alerts are set via the Risk Analysis Warnings settings that are configurable on the Risk Analysis home screen and discussed in this section.
Risk Analysis Warnings and Risk On-Screen Alerts
Risk analysis warning and risk based onscreen alerts are useful to help contract admins, staff members, procurement managers and working professional display meaning full messages on a record based on risk analysis and machine learning data. To add a Warning for risk mitigation, complete the Risk Analysis Definition configuration steps.
1. log in as a System Admin user.
2. Navigate to the Setup - Application Configuration - Risk Analysis Configuration menu.
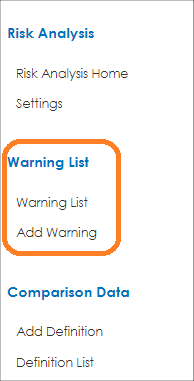
3. Click Add Warning to add and on-screen analytics alert message.
4. Select the area from the pick-list.
5. Select the field against which the warning/alert is to be displayed and click Next (at the bottom of the screen).

6. Select a defined statistical definition to use for the warning/alert and click Next.
7. Select the conditions for the warning/alert and click Next.
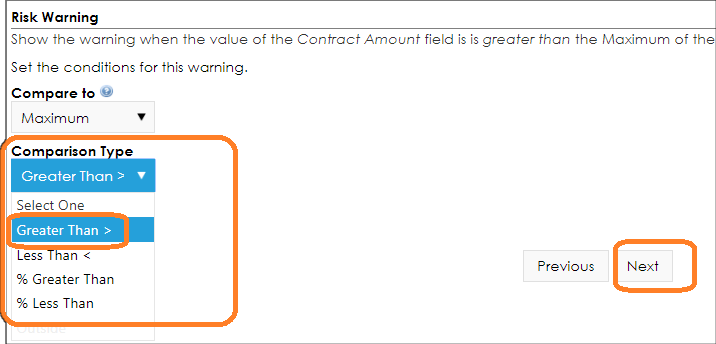
8. Select the comparison type for that condition.
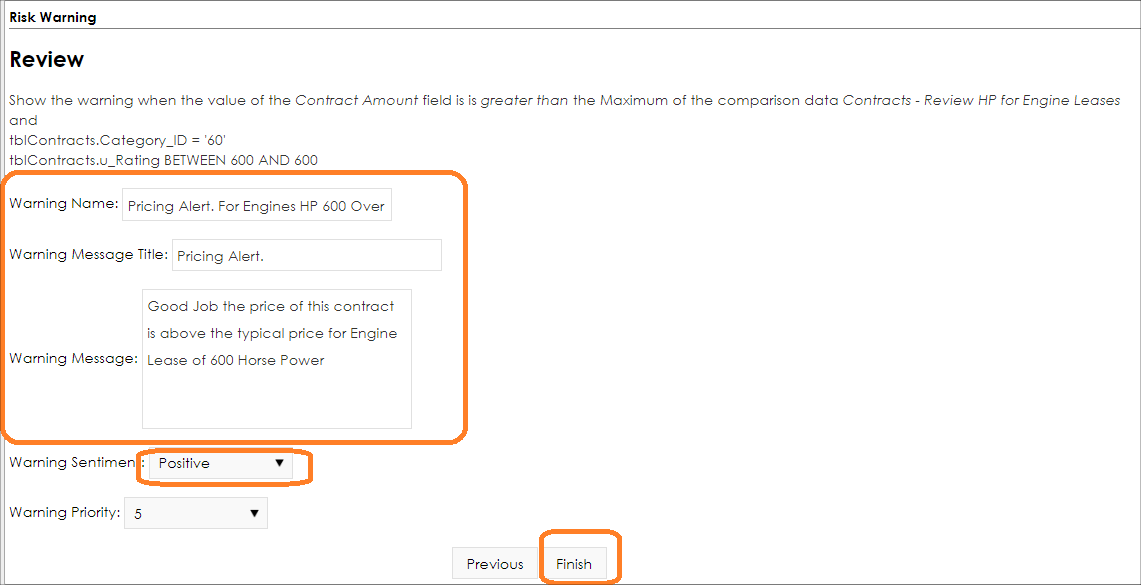
For the example, we shall display the warning when the value of the Contract Amount field is greater than the Maximum of the comparison data Contracts - Review HP for Engine Leases.
9. Set all criteria for the warning.
10. Review the warning criteria and provide the warning a Name, a Message Title, and a text Message.
11. Select if the Sentiment is positive or negative.
12. Select the Priority for the warning (how high or low on a possible list the warning is to display).
13. Click Finish.
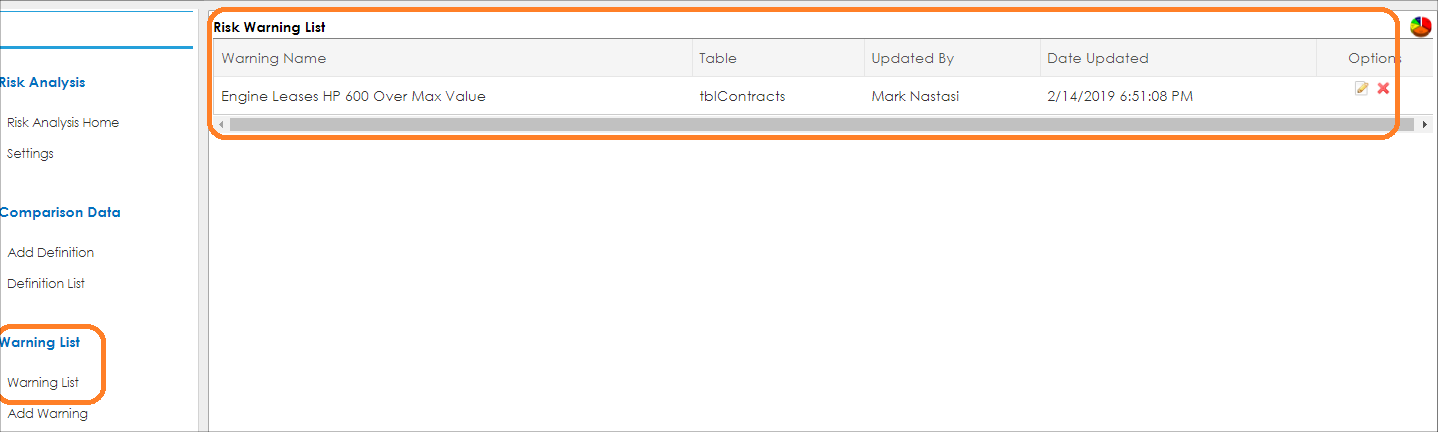
14. The Risk Warning List screen displays. All defined warnings are listed.
Next, we can add or visit a Contract Record that has a higher contract value for a 600 HP Engine lease to confirm our message will be displayed if the contract value is higher then the $6,000.00 highest price the risk engine last detected. As seen below, we can confirm our message has been displayed.
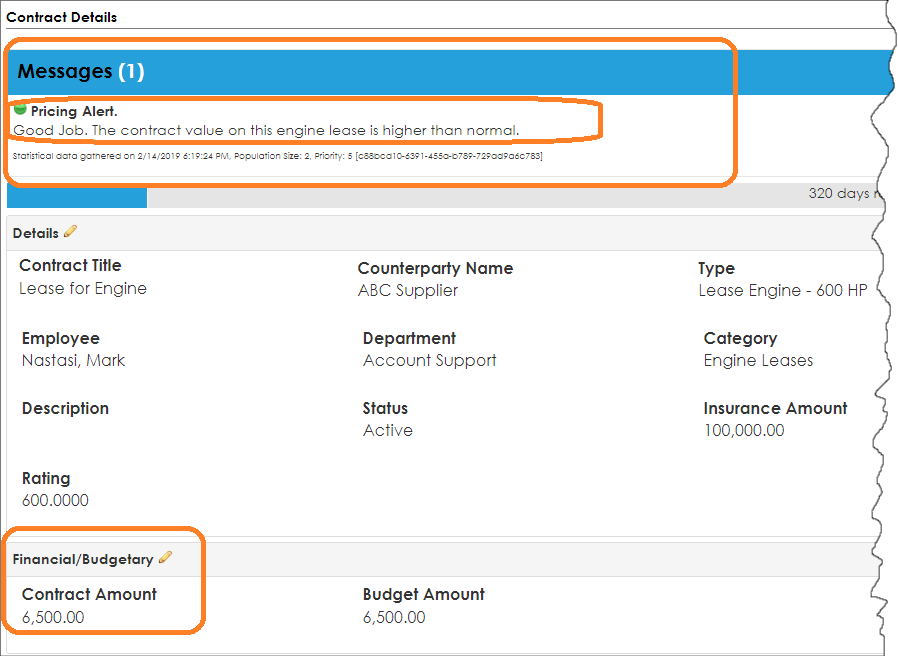
Even though we gave the warning a priority of 5, since it is the only one, it displays at the top. If another warning with a higher priority was also applicable to the record, that warning would appear higher on the list.
Keep in mind the next time this Risk Analysis Machine Learning job runs, the most recent contract data help adjust the Medium, Max, and Min values and subsequently the alerts will display based on the newly learned data.
Testing the Data for a Statistical Usage (fitness) for Risk Analysis
Oftentimes, professionals know their data and the trends related to their data due to their expertise in the field, length of time working the data, recognizing patterns, or simply being taught. In mathematics, to confirm if the data meaningful there are mathematics tools built to test data and its relationship to each other. In other words, there is a math to confirm our thoughts and hunch on how data may be related. Mathematics can help us confirm if the data is related, is the relationship statistically significant, and how strong that relationship is. In other words, is the data is meaningful for analysis. This is a complex area of maths named statistics. What Cobblestone Software’s VISDOM Risk Engine attempts to do is to make it simpler to use these tools. Typically, in predictive analysis, this is commonly referred to fitness of the data relationship to each other or its linear relationship. To confirm and prove that two data points have a strong relationship, VISDOM uses the CobbleStone Risk Analysis Engine.
Testing the Data
To perform a test of the data you want to analyze, log into the system as a System Admin user. Note, these tests are not stored in the system, they are just tools to confirm the relationship of data. The Risk Analysis with regression engine can be found under the Setup - Application Configuration - Risk Analysis Configuration menu
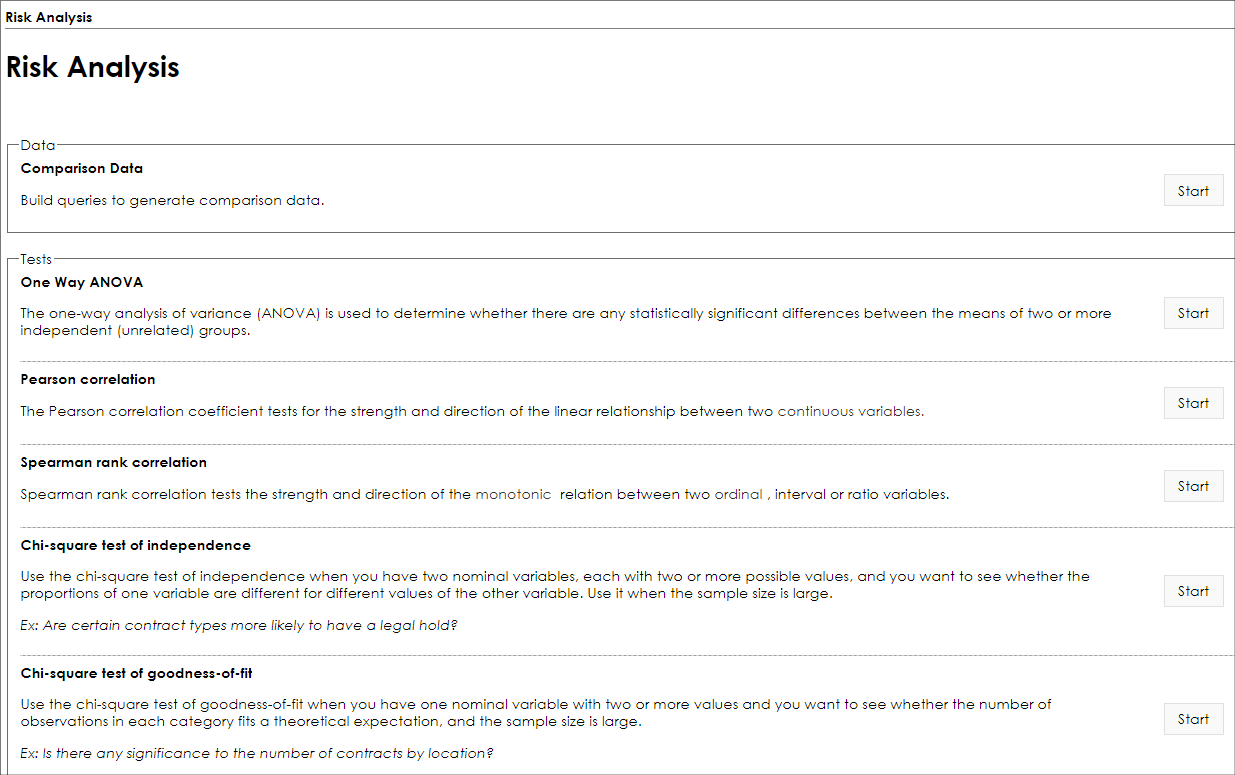
There are several types of statistical and regression processes available to use. Some of the tools are better served for a purpose. Below is a summary of each method.
Comparison Data: This tool enables a user to build queries [searches] to generate comparison data. This can help determine how.
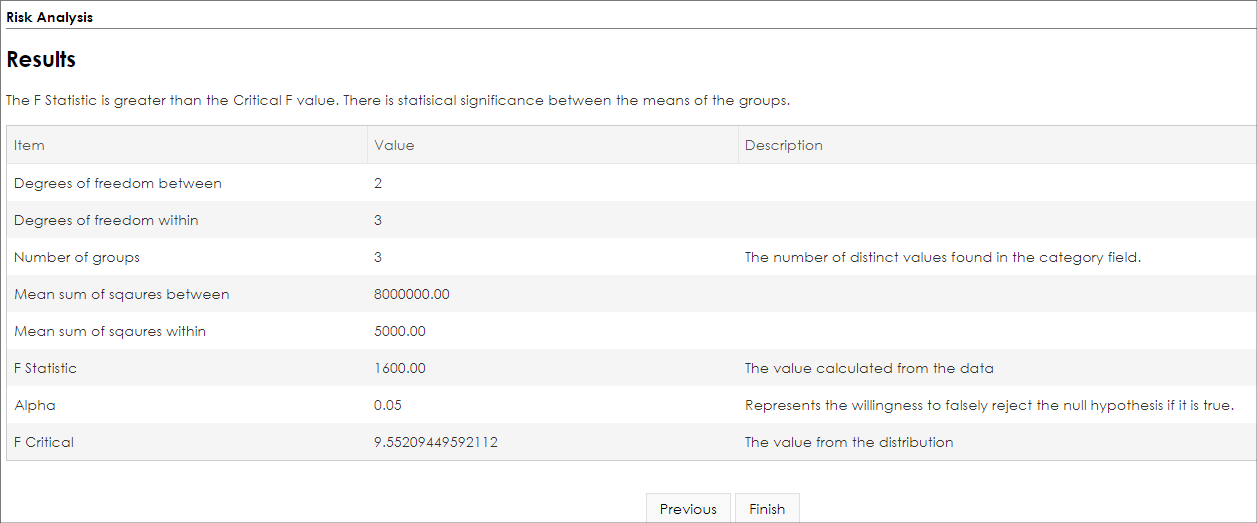
One Way ANOVA: The one-way analysis of variance (ANOVA) is used to determine whether there are any statistically significant differences between the means of two or more independent (unrelated) groups. For example, is the price of the contract related to contract type. For example, are Roofing Agreements costlier then Landscape Agreement.
Pearson correlation: The Pearson correlation coefficient tests for the strength and direction of the linear relationship between two continuous variables. For example, is there a strong relationship between the distance a customer is from our headquarters and the Contract Value. Hence, the further away a customer is, does it contract value go up or down?
Spearman rank correlation: Spearman rank correlation tests the strength and direction of the monotonic relation between two ordinal, interval or ratio variables. For example, does the cost of concrete go up the further away the delivery point is.
Chi-square test of independence: Use the chi-square test of independence when you have two nominal variables, each with two or more possible values, and you want to see whether the proportions of one variable are different for different values of the other variable. Use it when the sample size is large. For example, are certain contract types more likely to have a legal hold?
Chi-square test of goodness-of-fit: Use the chi-square test of goodness-of-fit when you have one nominal variable with two or more values and you want to see whether the number of observations in each category fits a theoretical expectation, and the sample size is large. For example, is there any significance to the number of contracts by location, are there a patter related to contract location?
Testing Data for a Regression and Risk Analysis
In statistics, it may be useful to mathematically confirm that there is a correlation of the data we want to analysis prior to configure rules that may not support our theory. Each method of detecting a pattern or relationship is slightly different and may vary for each specific business case. Below we will use Pearson correlation method to detect if the lease value (contract amount) of our contracts is higher based on the type of engine we lease. For example, we lease three engines types: a 200 HP (horse power) engine, a 400 HP engine and a 600 HP engine. We want to check that the contract data that we tracked when we lease an engine is price higher for a larger HP engine.
To perform a test of the data you want to analyze
1. log into the system as a System Admin user.
Note: These tests are not stored in the system, they are just tools to confirm the relationship of data.
2. The Risk Analysis with regression engine can be found by navigating to Manage/Setup - Application Configuration - Risk Analysis Configuration.
3. The Risk Analysis testing tool screen displays.
4. Click Start for the desired method. For the example, we shall use the One-Way ANOVA correlation risk tool.
5. Select the area of the system on which to perform the analysis. For our example, we are analyzing contract data, so we selected Contract Details.
6. Click Next.
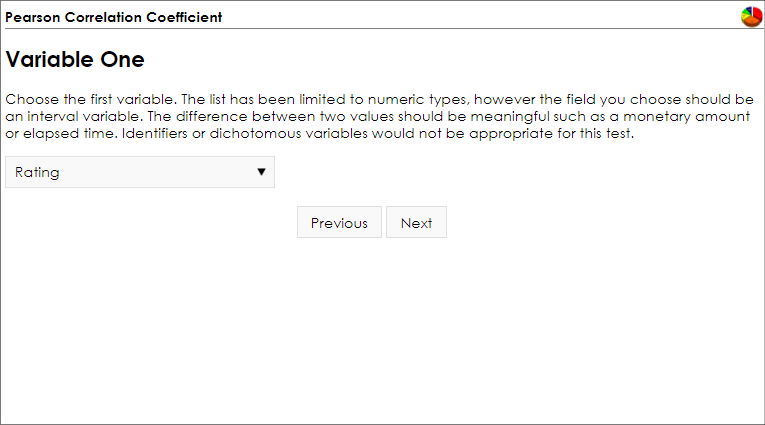
7. Select the field for the first variable to use in the analysis. In this example, we are selecting the Engine Rating field.
Note: Each system’s field names may be labeled differently; in this example, our field is named Rating.
8. Click Next.
9. Select the second variable. For this example, we will select Contract Amount for our analysis.
10. Add Filter Conditions (optional but recommended) to meet the specific purpose of your analysis. For the example, we only want to analyze records that are Engine Leases (based on the Contract Category field). Other filters may be based on contract type, department, location, employee, dates, and any other primary record fields made available to the engine.
11. Click Add. Once the criterion is saved, it displays in the Criteria area. From here, each may be edited by clicking the pencil icon. For this example, it is the only condition we want.
12. click Next.
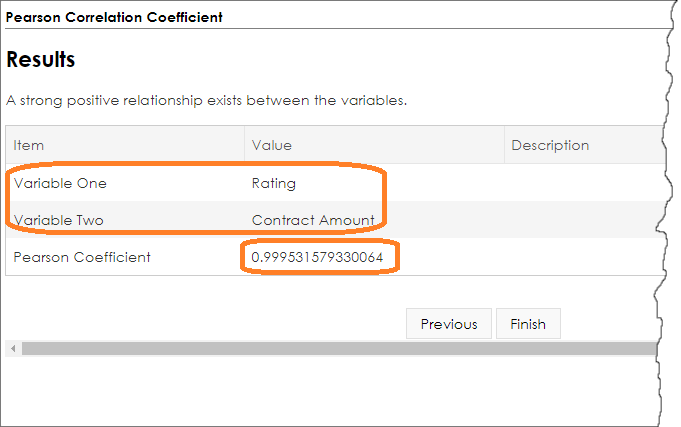
The results of our test are shown with the two field variables we analyzed, Contract Value and Engine Rating. Since we also set filter conditions for only where the Contract Category field is for Engine Leases, we get meaningful analysis specific to Engine Leases (and eliminate the unrelated data from contracts that are not Engine Lease contracts that may skew our regression test results). Our results in this analysis using Pearson Coefficient method proves that our data has a Pearson Coefficient (or correlation score) of 0.99953. This means there a is a very high relationship between the two fields we analyzed, and not only is the data correlated bus has a highly positive number that indicates there is a positive relationship between the two fields. A 0.9999 coefficient means that as Variable One increase, Variable Two increases. Our results confirm this is a good analysis and potential rule to use for risk detection and for which we may want to add onscreen alerts.
Note: A Risk Analyst tests as is not saved in the system and should be used only as a tool to confirm a theory and relationship of data. To use this in the actual risk engine job, we add this as a Risk Definition and assign a Warning/Alert (as discussed above).
Below is another example of a risk analysis test, one using Chi Square.
Note: Regression and statistics are a complex area of mathematics and should be confirmed by a qualified expert legal advice from an attorney.
|