|
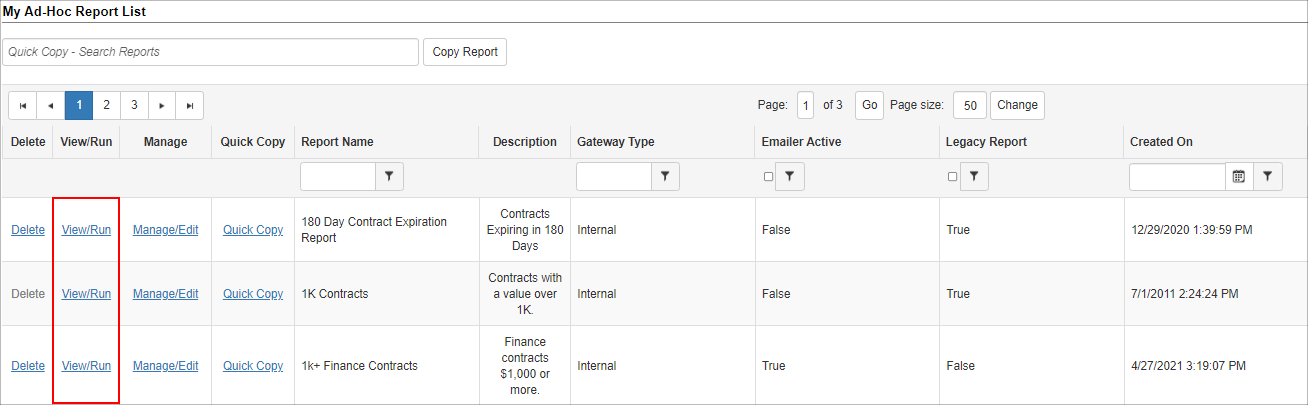
To run/execute an Ad-Hoc Report, click View/Run for the Ad-Hoc Report desired.
Contract Insight runs the selected Ad-Hoc Report and displays its results on a new page.
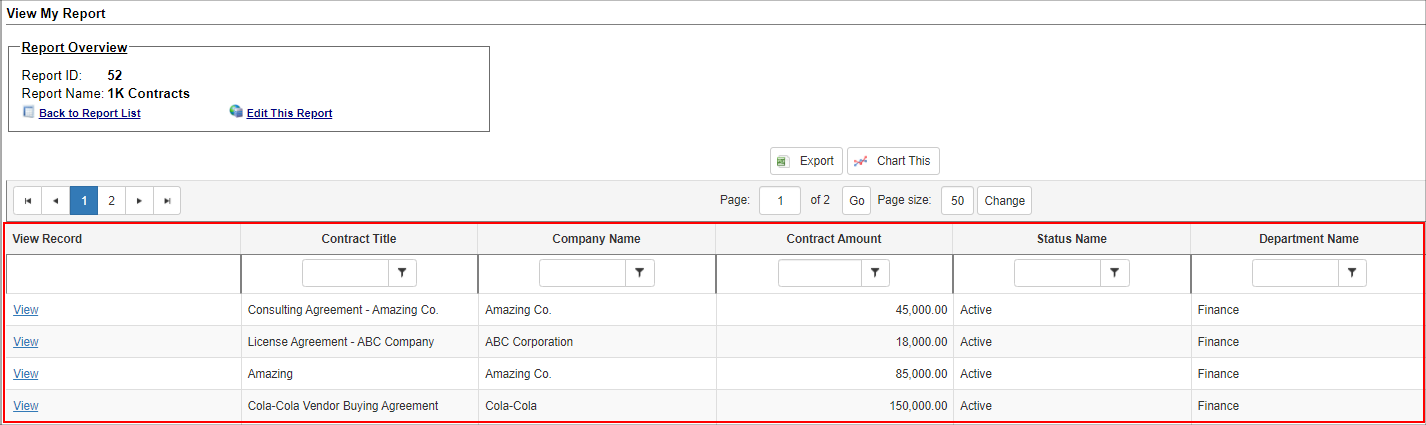
The results grid can be further sorted and filtered as needed using the header rows for each column/field. Additionally, the page size can be customized to any desired number, depending on how many records to be displayed on the page at a time.
In addition to the results grid, numerous options provide further management of the executed Ad-Hoc Report.
A. Back to Report List: This will return you to the list of Ad-Hoc Reports
B. Edit Report: This link will go into the Ad-Hoc Report Wizard for managing this executed Ad-Hoc Report and can only be performed by an admin or the creator of the report
C. Export the Ad-Hoc Report results: Export Results to an Excel format
Note: Best Practices recommend exporting Ad-Hoc report to Excel and then saving to PDF format.
D. Chart Ad-Hoc Report results data: This option opens the chart data page to visually chart the results provided
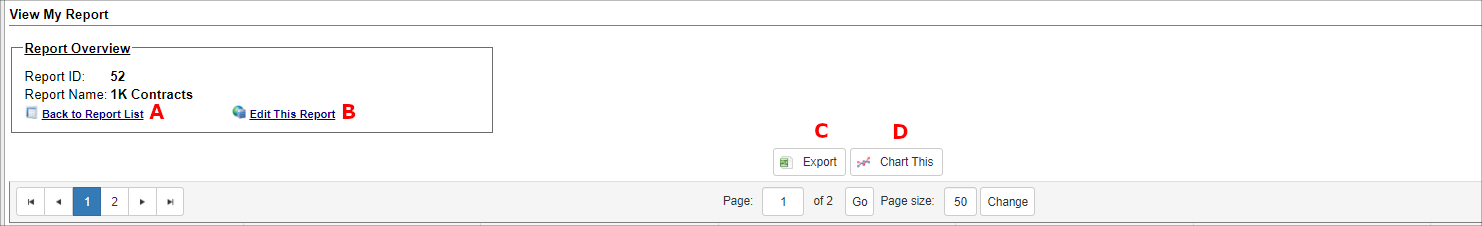
Chart This Data
Charting the results data will require the results to have at least one text-based field and one numeric based field and can be done by clicking Chart This Data.
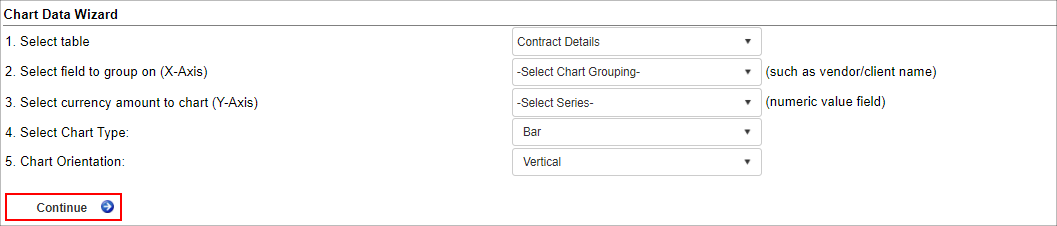
To generate a visual chart provide the following parameters:
1. Select field on which to group
- Select one of the text-based fields from the Ad-Hoc Report results.
- This will decide what field information on which to group the chart.
2. Select currency amount to chart
- Select one of the numeric based fields from the Ad-Hoc Report results.
- This will determine the second part of the field information on which to group the chart (data plotting).
3. Select Chart Type
- Specify which type of visual chart to generate.
4. Chart Orientation
- Decide if the chart should be oriented vertically or horizontally.
|